The Gini, in this case, is not Barbara Eden in the famous 70s T.V. show “I Dream of Jeannie”, but the widely used economic index which measures wealth inequality known as the Gini Coefficient.
The index has been around for over 100 years and was created by Corrado Gini, an Italian statistician, and sociologist. There is some very sophisticated math involved, but in simple terms, the coefficient is a numerical value that measures inequality (wealth or income) and ranges from 0 (no inequality) to 1 (extreme inequality).
The 10 most unequal wealth countries according to the Gini Index are:
- – South Africa – 0.63
- – Namibia – 0.59
- – Zambia – 0.57
- – Sao Tome and Principe – 0.56
- – Eswatini – 0.54
- – Mozambique – 0.54
- – Brazil – 0.53
- – Hong Kong – 0.53
- – Botswana – 0.53
- – Honduras – 0.52
Evolution of the Top 1% in the U.S.
As you can see, since the 1980s, income inequality and hence Gini coefficient in the U.S. has been on the rise. Even though overall household incomes have grown, upper-income households have seen much more rapid growth. Over the period, median middle-class income saw a gain of 49%, significantly less than the 64% gain for upper-household incomes. Income growth has been the most rapid for the top 5% of families.
Poverty is an increasing issue, with about 33 million workers earning less than $10 per hour, putting a family of four below the poverty level. Many of these low-wage workers have no sick days, pension, or health insurance.
Most of us are aware that the Covid-19 pandemic has further worsened this inequality by putting low-wage workers who worked mainly in the badly hit services sector out of work. However, the impact of the Fed’s quantitative easing used to stabilize the economy on inequality is often ignored.
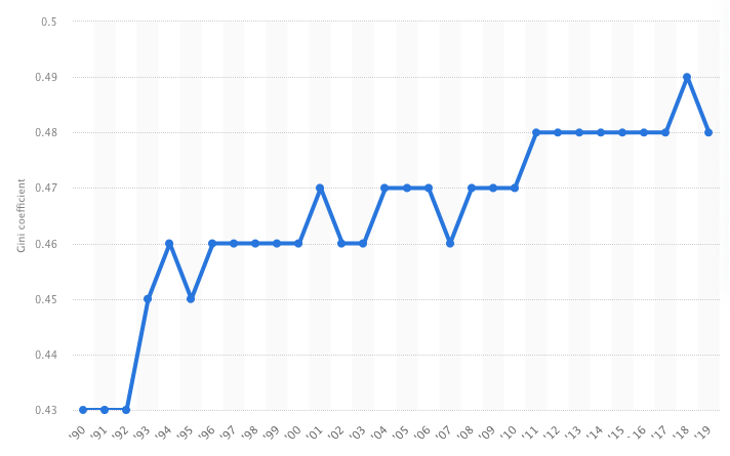
U.S. household income Gini coefficient over the years (1990 – 2019)
(Source: Statista)
Did the Fed let the Gini out of the Bottle?
During the pandemic, the economy faltered due to a fall in aggregate demand. To prop up demand and stimulate spending from households and businesses, the Fed had to cut interest rates (cost of borrowing). However, because there has been a steady decline in natural interest rates over the years, the Fed finds itself being very close to the effective lower bound of policy rates. This means they have little room to cut rates further, and interest rate cuts are not enough to achieve the desired level of economic activity. To further stimulate demand, the Fed uses quantitative easing, which is a process of injecting money into the economy and further driving down rates.
Quantitative easing widened the inequality gap in 3 ways.
1 – Since quantitative easing drives down interest rates, it lowers the return savers get from depositing their money in the bank, for example. The lower returns have forced average savers to put more money into riskier investments such as stocks to receive stronger returns. This additional demand pushes stock prices upwards and benefits those who own stocks – high-wealth households. The wealthiest 10% owns 89% of stocks and mutual fund shares, so to say they benefitted greatly from the stock market’s $22.4 trillion gain in value since last year would be an understatement. To put it into perspective, $20 trillion went to just 10% of households, leaving the remaining 90% to split $2.4 trillion.
2 – Record-low policy rates of 0.25% during the pandemic meant that mortgage rates were also at rock bottom. Well-heeled households who may have benefitted from the stock market saw this as the perfect opportunity to buy second, more spacious homes to escape to during the pandemic.
The increased demand, together with the Fed’s large purchase of mortgage-backed securities, has caused home prices to soar – nationwide, median prices rose 22.9% y-o-y to $357,900 in 2nd quarter. This is nearly 10 times the median annual income of low-income families.
Affordability has declined in 45 out of 50 major markets, locking many low incomers out of the market. Home prices rocketing has also benefitted real estate owners, which happen to be middle to high-wealth households. The wealthiest 10% own 45% of real estate, and the remainder is owned largely by middle-class households. Low-incomers rarely own homes; hence they get a negligible share of the housing market’s $2.5 trillion gain in value.
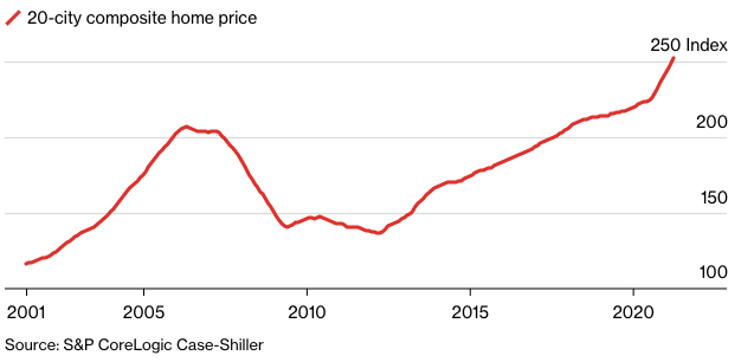
20-city composite home price index
(Source: Bloomberg)
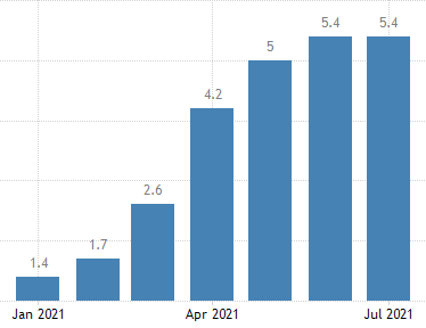
3 – A consequence of the Fed pumping more than $9 trillion into the economy and increasing money supply is inflation. In our previous article, we discussed the current inflation trends. Wage growth has been struggling to keep up with the sheer rate at which the cost of living has been rising. This means lower purchasing power for low- and middle-income Americans. Because they earn less and things such as groceries take up a larger portion of their income, they feel a greater pinch when prices of necessities rise. Thus, this is another instance of the poor suffering disproportionately more than the rich.
What our Crystal Ball says
Our macro team expects inequality to get worse. To keep low-income households employed, the Fed has to continue keeping rates low and the stimulus faucet running. This is especially so given the threat of the Delta variant that could potentially send us back into a recession. But an inevitable and perverse side effect of supporting the economy is increasing wealth for the wealthy, further broadening the disparity.
Once low-income workers start demanding higher salaries, there will be further inflationary pressures, but wage growth will unlikely outpace increases in costs. This means lower-income households will be playing a never-ending catch-up game and trying to get onto the “economic ladder.”
The Investment Thesis – Buy Investment Property. Yields will head higher!
As wealth dislocations continue around the world, we see above that it will benefit those who own assets. We argue that it will particularly benefit those who own homes, given the potential of future rental yields. With how unaffordable homes are right now, an increasing number are turning to rent; this has driven up rental prices significantly. In fact, in July, rentals for new leases increased by 17% compared to what previous tenants paid. We foresee that in 3 years’ time, the rental yield will be 15-20% on average! Investing in rental property is one of the best trades we can have now and can help prevent one from slipping down the “economic ladder.”
Read our previous research called Does Hedonism affect CPI? which discusses why rental yields will continue to rise.
Get in touch with us today to find out more at www.americamortgages.com.
